Image
The Massachusetts Current Economic Index for September was 235.7, down 3.7 percent from August (at annual rates), and up 3.8 percent from September 2022. The current index is normalized to 100 in July 1987 and is calibrated to grow at the same rate as Massachusetts real gross domestic product over the 1978–2022 period.
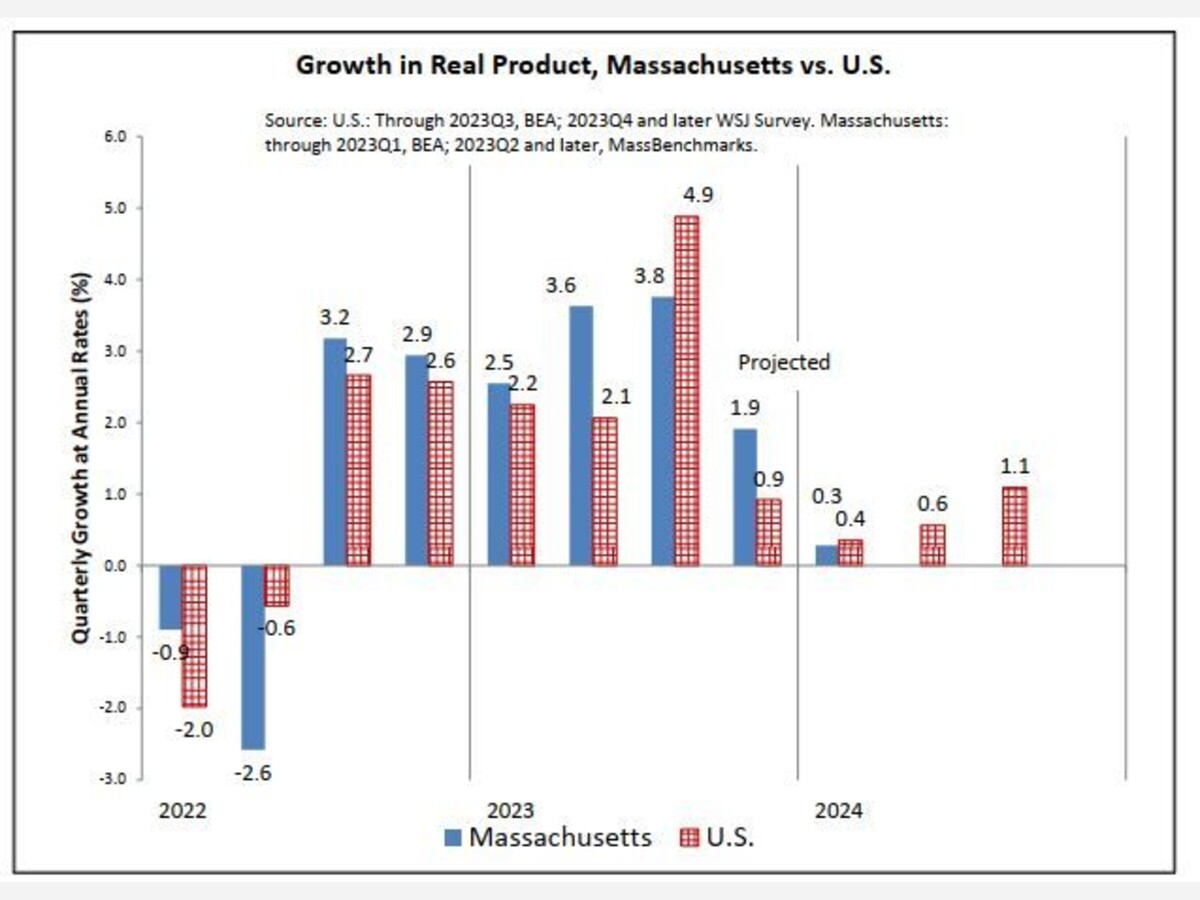
In the third quarter of 2023, Massachusetts real gross state product (GDP) increased at a 3.8 percent annualized rate, according to MassBenchmarks, while U.S. GDP increased at a 4.9 percent annualized rate, according to the U.S. Bureau of Economic Analysis (BEA). In the second quarter of 2023, Massachusetts GDP increased at a 3.6 percent annualized rate according to MassBenchmarks while U.S. GDP increased at a 2.1 percent annualized rate according to the BEA.
The strong third quarter was a surprise to economists, who in July were projecting growth of less than one percent annualized in the third quarter. The MassBenchmarks estimate for state GDP growth for the third quarter was 0.7 percent, while the survey of economists by the Wall Street Journal was expecting 0.6 percent for the U.S. Vigorous job growth and robust consumer spending in the summer accounted for the strong growth, as well as additions to inventories. Growth is expected to slow substantially in the fall and winter.
Payroll employment grew by 1.7 percent on an annualized basis in the third quarter in both Massachusetts and the U.S., a notable pace given the efforts of the Fed to slow the economy. It is unlikely that this pace will be maintained in the current quarter. Nationally, payroll growth slowed in October. (State estimates for October will be available later this month.)
In Massachusetts, there appears to be little capacity for squeezing more workers out of the population. Unemployment rates in the state are at historic lows, at 2.6 percent in September versus 3.8 percent for the U.S. The broader U-6 unemployment rate measure, which counts involuntary part-time workers and persons marginally-attached to the labor force as unemployed is only 5.4 percent in Massachusetts, close to a historical low. The number of part-time workers who want full-time work is roughly 25 percent lower than the pre-pandemic level, and the number of marginallyattached workers is also substantially below pre-pandemic levels. Labor force participation rates in the state have not returned to pre-pandemic levels, but that does not indicate slack or the capacity to add new workers; rather it reflects the demographic aging of the working age population. Prime-aged workers (25-54 years old) are participating at pre-pandemic rates, but not older workers, as the average age of the 55+ year old cohort is rising as baby boomers age.
Income and spending indicators in Massachusetts – based on tax revenues – indicate some weakness in the state’s economy relative to the U.S. While wage and salary income nationally rose at a 5.6 percent annualized rate in the third quarter according to the BEA, wage and salary income based on state withholding tax revenues rose at a slower 3.5 percent annualized rate in the third quarter.
Spending on items subject to the state’s regular sales tax and the motor vehicle sales tax declined substantially in the third quarter, at nearly a 25 percent annualized rate. This is a volatile measure – such tax revenues can fluctuate substantially from quarter to quarter – but a change of this magnitude is not common. While most of this spending reflects consumer spending on goods, a significant proportion of the amount – perhaps a fifth – reflects business spending on taxable goods.
Adding to the expectation of slower growth in the current quarter is a slow upward trend in a measure of state unemployment claims, the number of first payments. This is not a sharp rise indicative of a turning point but is consistent with a softening in labor demand or of a longer job search for job switchers.
Inflation, as measured by the Bureau of Labor Statistics headline consumer price index, was more moderate in the Boston metropolitan area than in the nation as a whole. On an annualized quarterly basis, prices in the Boston area rose 2.2 percent versus 3.6 percent for the U.S. in the third quarter. Netting out food and energy, core prices rose 1.8 percent in Boston versus 2.8 percent in the U.S. in the third quarter. Relative to the third quarter of 2022, overall prices in the Boston area were 2.7 percent higher in the third quarter 2023, versus 3.6 percent for the U.S., while core prices were 3.5 percent higher in Boston versus 4.4 percent for the U.S.
Growth in Massachusetts GDP is expected to slow to a 1.9 percent annualized rate in the fourth quarter and to a 0.3 percent rate in the first quarter of next year. Driving this slowdown are the leading indicators for motor vehicle spending, unemployment claims, stock prices, the 10-year less 3-month treasury rate spread (related to Fed interest rate policy), and lackluster consumer confidence. The average expectations for U.S. GDP growth from the Wall Street Journal’s October survey of economists is for 0.9 percent growth in the fourth quarter and 0.4 percent growth in the first quarter of next year.
The current and historical quarterly estimates for state domestic product growth include adjustments for changes in productivity growth. These adjustments are estimates of the quarterly deviations from the 1978-2022 trend in the growth of the ratio of output to employment. In the third quarter of 2023, these adjustments added 0.9 percentage points to growth. In the second quarter of 2023, these adjustments subtracted 1.9 percentage points from growth. In the first quarter of 2023, these adjustments subtracted 2.5 percentage points from growth. In the fourth quarter of 2023 and the first quarter of 2024 these adjustments are expected to add 0.9 percentage points to growth.
The current and historical quarterly estimates also include “cyclical” adjustments, as the relationship between the growth in the current indicators and that of gross domestic product changes over the course of the business cycle. In the third quarter of 2023, these adjustments added 0.9 percentage points to growth. In the second quarter of 2023 these adjustments
subtracted 2.7 percentage points from growth. In the first quarter of 2023 these adjustments subtracted 0.5 percentage points from growth. In the fourth quarter of 2023 and the first quarter of 2024 these adjustments are expected to add 4.7 and 4.9 percentage points to growth respectively.
Several recent months of the current index are revised each release. These revisions are a result of the statistical method used to create the index, as well as revisions in the underlying indicators.
All the indicators in the current index refer to Massachusetts. The current index is composed of four indicators: nonagricultural employment, withholding taxes, sales taxes, and the unemployment rate. Withholding taxes and sales taxes are deflated by the U.S. consumer price index for all urban consumers, excluding food and energy.
For a description of the methodology used to construct this index, see: Alan Clayton-Matthews and James H. Stock, “An application of the Stock/Watson index methodology to the Massachusetts economy”, Journal of Economic and Social Measurement, vol. 25 (1998/1999), pp. 183-233.
Alan Clayton-Matthews November 6, 2023 MassBenchmarks Associate Professor Emeritus School of Public Policy and Urban Affairs and the Department of Economics Northeastern University


Sunny, with a high of 43 and low of 25 degrees. Sunny for the morning, overcast in the afternoon and evening, clear overnight.